
Showing posts with label Econometrics and Statistics. Show all posts
Showing posts with label Econometrics and Statistics. Show all posts
Saturday, March 23, 2019
Big Data in Dynamic Predictive Modeling
Our Journal of Econometrics issue, Big Data in Dynamic Predictive Econometric Modeling, is now in press. It is partly based on a Penn conference, generously supported by Penn's Warren Center for Network and Data Sciences, University of Chicago's Stevanovich Center for Financial Mathematics, and Penn's Institute for Economic Research. The intro is here and the paper list is here.

Wednesday, March 6, 2019
Significance Testing as a Noise Amplifier
See this insightful post on why statistical significance testing is effectively a noise amplifier. I find it interesting along the lines of "something not usually conceptualized in terms of XX is revealed to be very much about XX". In this case XX is noise amplification / reduction. Like many good insights, it seems obvious ex post, but no one recognized it before the "eureka moment".
So significance testing is really a filter: The input is data and the output is an accept/reject decision for some hypothesis. But what a non-linear, imprecisely-defined, filter -- we're a long way from looking at the gain functions of simple linear filters as in classical frequency-domain filter analysis!
See also this earlier post on significance testing.
So significance testing is really a filter: The input is data and the output is an accept/reject decision for some hypothesis. But what a non-linear, imprecisely-defined, filter -- we're a long way from looking at the gain functions of simple linear filters as in classical frequency-domain filter analysis!
See also this earlier post on significance testing.
Sunday, March 3, 2019
Standard Errors for Things that Matter
Many times in applied / empirical seminars I have seen something like this:
The paper estimates a parameter vector b and dutifully reports asymptotic s.e.'s. But then the ultimate object of interest turns out not to be b, but rather some nonlinear but continuous function of the elements of b, say c = f(b). So the paper calculates and reports an estimate of c as c_hat = f(b_hat). Fine, insofar as c_hat is consistent if b_hat is consistent. But then the paper forgets to calculate an asymptotic s.e. for c_hat.
So c is the object of interest, and hundreds, maybe thousands, of person-hours are devoted to producing a point estimate of c, but then no one remembers (cares?) to assess its estimation uncertainty. Geez. Of course one could do delta method, simulation, etc.
The paper estimates a parameter vector b and dutifully reports asymptotic s.e.'s. But then the ultimate object of interest turns out not to be b, but rather some nonlinear but continuous function of the elements of b, say c = f(b). So the paper calculates and reports an estimate of c as c_hat = f(b_hat). Fine, insofar as c_hat is consistent if b_hat is consistent. But then the paper forgets to calculate an asymptotic s.e. for c_hat.
So c is the object of interest, and hundreds, maybe thousands, of person-hours are devoted to producing a point estimate of c, but then no one remembers (cares?) to assess its estimation uncertainty. Geez. Of course one could do delta method, simulation, etc.
Wednesday, February 20, 2019
Modified CRLB with Differential Privacy
It turns out that with differential privacy the Cramer-Rao lower bound (CRLB) is not achievable (too bad for MLE), but you can figure out what *is* achievable, and find estimators that do the trick. (See the interesting talk here by Feng Ruan, and the associated papers on his web site.) The key point is that estimation efficiency is degraded by privacy. The new frontier seems to me to be this: Let's go beyond stark "privacy" or "no privacy" situations, because in reality there is a spectrum of "epsilon-strengths" of "epsilon-differential" privacy. (Right?) Then there is a tension: I like privacy, but I also like estimation efficiency, and the two trade off against each other. So there is a choice to be made, and the optimum depends on preferences.
Monday, December 3, 2018
Dual Regression and Prediction
Richard Spady and Sami Stouli have an interesting new paper, “Dual Regression". They change the usual OLS loss function from quadratic to something related but different, as per their equation (2.2), and they get impressive properties for estimation under correct specification. They also have some results under misspecification.
I'd like to understand more regarding dual regression's properties for prediction under misspecification. Generally we're comfortable with quadratic loss, in which case OLS delivers the goods (the conditional mean or linear projection) in large samples under great generality (e.g., see here). The dual regression estimator, in contrast, has a different probability limit under misspecification -- it's not providing a KLIC-optimal approximation.
If the above sounds negative, note well that the issue raised may be an opportunity, not a pitfall! Certainly there is nothing sacred about quadratic loss, even if the conditional mean is usually a natural predictor. We sometimes move to absolute-error loss (conditional median predictor), check-function loss (conditional quantile predictor), or all sorts of other predictive loss functions depending on the situation. But movements away from conditional mean or median prediction generally require some justification and interpretation. Equivalently, movements away from quadratic or absolute predictive loss generally require some justification and interpretation. I look forward to seeing that for the loss function that drives dual regression.
I'd like to understand more regarding dual regression's properties for prediction under misspecification. Generally we're comfortable with quadratic loss, in which case OLS delivers the goods (the conditional mean or linear projection) in large samples under great generality (e.g., see here). The dual regression estimator, in contrast, has a different probability limit under misspecification -- it's not providing a KLIC-optimal approximation.
If the above sounds negative, note well that the issue raised may be an opportunity, not a pitfall! Certainly there is nothing sacred about quadratic loss, even if the conditional mean is usually a natural predictor. We sometimes move to absolute-error loss (conditional median predictor), check-function loss (conditional quantile predictor), or all sorts of other predictive loss functions depending on the situation. But movements away from conditional mean or median prediction generally require some justification and interpretation. Equivalently, movements away from quadratic or absolute predictive loss generally require some justification and interpretation. I look forward to seeing that for the loss function that drives dual regression.
Monday, April 2, 2018
Econometrics, Machine Learning, and Big Data
Here's a useful slide deck by Greg Duncan at Amazon, from a recent seminar at FRB San Francisco (powerpoint, ughhh, sorry...). It's basically a superset of the keynote talk he gave at Penn's summer 2017 conference, Big Data in Predictive Dynamic Econometric Modeling. Greg understands better than most the close connection between "machine learning" and econometrics / statistics, especially between machine learning and the predictive perspective emphasized in time series for a century or so.
Monday, March 12, 2018
Sims on Bayes
Here's a complementary and little-known set of slide decks from Chris Sims, deeply insightful as always. Together they address some tensions associated with Bayesian analysis and sketch some resolutions. The titles are nice, and revealing. The first is "Why Econometrics Should Always and Everywhere Be Bayesian". The second is "Limits to Probability Modeling" (with Chris' suggested possible sub-title: "Why are There no Real Bayesians?").
Monday, September 4, 2017
More on New p-Value Thresholds
I recently blogged on a new proposal heavily backed by elite statisticians to "redefine statistical significance", forthcoming in the elite journal Nature Human Behavior. (A link to the proposal appears at the end of this post.)
I have a bit more to say. It's not just that I find the proposal counterproductive; I have to admit that I also find it annoying, bordering on offensive.
I find it inconceivable that the authors' p<.005 recommendation will affect their own behavior, or that of others like them. They're all skilled statisticians, hardly so naive as to declare a "discovery" simply because a p-value does or doesn't cross a magic threshold, whether .05 or .005. Serious evaluations and interpretations of statistical analyses by serious statisticians are much more nuanced and rich -- witness the extended and often-heated discussion in any good applied statistics seminar.
If the p<.005 threshold won't change the behavior of skilled statisticians, then whose behavior MIGHT it change? That is, reading between the lines, to whom is the proposal REALLY addressed? Evidently those much less skilled, the proverbial "practitioners", who the authors evidently hope to keep out of trouble by providing a rule of thumb that can at least be followed mechanically.
How patronizing.
------
Redefine Statistical Significance
I have a bit more to say. It's not just that I find the proposal counterproductive; I have to admit that I also find it annoying, bordering on offensive.
I find it inconceivable that the authors' p<.005 recommendation will affect their own behavior, or that of others like them. They're all skilled statisticians, hardly so naive as to declare a "discovery" simply because a p-value does or doesn't cross a magic threshold, whether .05 or .005. Serious evaluations and interpretations of statistical analyses by serious statisticians are much more nuanced and rich -- witness the extended and often-heated discussion in any good applied statistics seminar.
If the p<.005 threshold won't change the behavior of skilled statisticians, then whose behavior MIGHT it change? That is, reading between the lines, to whom is the proposal REALLY addressed? Evidently those much less skilled, the proverbial "practitioners", who the authors evidently hope to keep out of trouble by providing a rule of thumb that can at least be followed mechanically.
How patronizing.
------
Redefine Statistical Significance
Date: 2017
By:
Daniel Benjamin ; James Berger ; Magnus Johannesson ; Brian Nosek ; E. Wagenmakers ; Richard Berk ; Kenneth Bollen ; Bjorn Brembs ; Lawrence Brown ; Colin Camerer ; David Cesarini ; Christopher Chambers ; Merlise Clyde ; Thomas Cook ; Paul De Boeck ; Zoltan Dienes ; Anna Dreber ; Kenny Easwaran ; Charles Efferson ; Ernst Fehr ; Fiona Fidler ; Andy Field ; Malcom Forster ; Edward George ; Tarun Ramadorai ; Richard Gonzalez ; Steven Goodman ; Edwin Green ; Donald Green ; Anthony Greenwald ; Jarrod Hadfield ; Larry Hedges ; Leonhard Held ; Teck Hau Ho ; Herbert Hoijtink ; James Jones ; Daniel Hruschka ; Kosuke Imai ; Guido Imbens ; John Ioannidis ; Minjeong Jeon ; Michael Kirchler ; David Laibson ; John List ; Roderick Little ; Arthur Lupia ; Edouard Machery ; Scott Maxwell; Michael McCarthy ; Don Moore ; Stephen Morgan ; Marcus Munafo ; Shinichi Nakagawa ; Brendan Nyhan ; Timothy Parker ; Luis Pericchi; Marco Perugini ; Jeff Rouder ; Judith Rousseau ; Victoria Savalei ; Felix Schonbrodt ; Thomas Sellke ; Betsy Sinclair ; Dustin Tingley; Trisha Zandt ; Simine Vazire ; Duncan Watts; Christopher Winship ; Robert Wolpert ; Yu Xie; Cristobal Young ; Jonathan Zinman ; Valen Johnson
Abstract: We propose to change the default P-value threshold for statistical significance for claims of new discoveries from 0.05 to 0.005.
http://d.repec.org/n?u=RePEc:feb:artefa:00612&r=ecm
By:
Daniel Benjamin ; James Berger ; Magnus Johannesson ; Brian Nosek ; E. Wagenmakers ; Richard Berk ; Kenneth Bollen ; Bjorn Brembs ; Lawrence Brown ; Colin Camerer ; David Cesarini ; Christopher Chambers ; Merlise Clyde ; Thomas Cook ; Paul De Boeck ; Zoltan Dienes ; Anna Dreber ; Kenny Easwaran ; Charles Efferson ; Ernst Fehr ; Fiona Fidler ; Andy Field ; Malcom Forster ; Edward George ; Tarun Ramadorai ; Richard Gonzalez ; Steven Goodman ; Edwin Green ; Donald Green ; Anthony Greenwald ; Jarrod Hadfield ; Larry Hedges ; Leonhard Held ; Teck Hau Ho ; Herbert Hoijtink ; James Jones ; Daniel Hruschka ; Kosuke Imai ; Guido Imbens ; John Ioannidis ; Minjeong Jeon ; Michael Kirchler ; David Laibson ; John List ; Roderick Little ; Arthur Lupia ; Edouard Machery ; Scott Maxwell; Michael McCarthy ; Don Moore ; Stephen Morgan ; Marcus Munafo ; Shinichi Nakagawa ; Brendan Nyhan ; Timothy Parker ; Luis Pericchi; Marco Perugini ; Jeff Rouder ; Judith Rousseau ; Victoria Savalei ; Felix Schonbrodt ; Thomas Sellke ; Betsy Sinclair ; Dustin Tingley; Trisha Zandt ; Simine Vazire ; Duncan Watts; Christopher Winship ; Robert Wolpert ; Yu Xie; Cristobal Young ; Jonathan Zinman ; Valen Johnson
Abstract: We propose to change the default P-value threshold for statistical significance for claims of new discoveries from 0.05 to 0.005.
http://d.repec.org/n?u=RePEc:feb:artefa:00612&r=ecm
Sunday, August 27, 2017
New p-Value Thresholds for Statistical Significance
This is presently among the hottest topics / discussions / developments in statistics. Seriously. Just look at the abstract and dozens of distinguished authors of the paper below, which is forthcoming in one of the world's leading science outlets, Nature Human Behavior.
Of course data mining, or overfitting, or whatever you want to call it, has always been a problem, warranting strong and healthy skepticism regarding alleged "new discoveries". But the whole point of examining p-values is to AVOID anchoring on arbitrary significance thresholds, whether the old magic .05 or the newly-proposed magic .005. Just report the p-value, and let people decide for themselves how they feel. Why obsess over asterisks, and whether/when to put them next to things?
Postscript:
Reading the paper, which I had not done before writing the paragraph above (there's largely no need, as the wonderfully concise abstract says it all), I see that it anticipates my objection at the end of a section entitled "potential objections":
The paper offers only a feeble refutation of that "potential" objection:
Of course data mining, or overfitting, or whatever you want to call it, has always been a problem, warranting strong and healthy skepticism regarding alleged "new discoveries". But the whole point of examining p-values is to AVOID anchoring on arbitrary significance thresholds, whether the old magic .05 or the newly-proposed magic .005. Just report the p-value, and let people decide for themselves how they feel. Why obsess over asterisks, and whether/when to put them next to things?
Postscript:
Reading the paper, which I had not done before writing the paragraph above (there's largely no need, as the wonderfully concise abstract says it all), I see that it anticipates my objection at the end of a section entitled "potential objections":
Changing the significance threshold is a distraction from the real solution, which is to replace null hypothesis significance testing (and bright-line thresholds) with more focus on effect sizes and confidence intervals, treating the P-value as a continuous measure, and/or a Bayesian method.Here here! Marvelously well put.
The paper offers only a feeble refutation of that "potential" objection:
Many of us agree that there are better approaches to statistical analyses than null hypothesis significance testing, but as yet there is no consensus regarding the appropriate choice of replacement. ... Even after the significance threshold is changed, many of us will continue to advocate for alternatives to null hypothesis significance testing.I'm all for advocating alternatives to significance testing. That's important and helpful. As for continuing to promulgate significance testing with magic significance thresholds, whether .05 or .005, well, you can decide for yourself.
Redefine Statistical Significance
Sunday, July 23, 2017
On the Origin of "Frequentist" Statistics
Efron and Hastie note that the "frequentist" term "seems to have been suggested by Neyman as a statistical analogue of Richard von Mises' frequentist theory of probability, the connection being made explicit in his 1977 paper, 'Frequentist Probability and Frequentist Statistics'". It strikes me that I may have always subconsciously assumed that the term originated with one or another Bayesian, in an attempt to steer toward something more neutral than "classical", which could be interpreted as "canonical" or "foundational" or "the first and best". Quite fascinating that the ultimate "classical" statistician, Neyman, seems to have initiated the switch to "frequentist".
Monday, July 3, 2017
Bayes, Jeffreys, MCMC, Statistics, and Econometrics
In Ch. 3 of their brilliant book, Efron and Tibshirani (ET) assert that:
Jeffreys’ brand of Bayesianism [i.e., "uninformative" Jeffreys priors] had a dubious reputation among Bayesians in the period 1950-1990, with preference going to subjective analysis of the type advocated by Savage and de Finetti. The introduction of Markov chain Monte Carlo methodology was the kind of technological innovation that changes philosophies. MCMC ... being very well suited to Jeffreys-style analysis of Big Data problems, moved Bayesian statistics out of the textbooks and into the world of computer-age applications.Interestingly, the situation in econometrics strikes me as rather the opposite. Pre-MCMC, much of the leading work emphasized Jeffreys priors (RIP Arnold Zellner), whereas post-MCMC I see uniform at best (still hardly uninformative as is well known and as noted by ET), and often Gaussian or Wishart or whatever. MCMC of course still came to dominate modern Bayesian econometrics, but for a different reason: It facilitates calculation of the marginal posteriors of interest, in contrast to the conditional posteriors of old-style analytical calculations. (In an obvious notation and for an obvious normal-gamma regression problem, for example, one wants posterior(beta), not posterior(beta | sigma).) So MCMC has moved us toward marginal posteriors, but moved us away from uninformative priors.
Saturday, April 29, 2017
Predictive Modeling and Causal Estimation

Here are the slides, "Econometrics, Predictive Modeling, and Causal Estimation", from my talk at the recent conference at the IMF in honor of Kajal Lahiri's 70th (group photo above). They build on an earlier No Hesitations post.
Sunday, March 19, 2017
ML and Metrics VIII: The New Predictive Econometric Modeling
[Click on "Machine Learning" at right for earlier "Machine Learning and Econometrics" posts.]
We econometricians need -- and have always had -- cross section and time series ("micro econometrics" and "macro/financial econometrics"), causal estimation and predictive modeling, structural and non-structural. And all continue to thrive.
But there's a new twist, happening now, making this an unusually exciting time in econometrics. Predictive econometric modeling is not only alive and well, but also blossoming anew, this time at the interface of micro-econometrics and machine learning. A fine example is the new Kleinberg, Lakkaraju, Leskovic, Ludwig and Mullainathan paper, “Human Decisions and Machine Predictions”, NBER Working Paper 23180 (February 2017).
Good predictions promote good decisions, and econometrics is ultimately about helping people to make good decisions. Hence the new developments, driven by advances in machine learning, are most welcome contributions to a long and distinguished predictive econometric modeling tradition.
We econometricians need -- and have always had -- cross section and time series ("micro econometrics" and "macro/financial econometrics"), causal estimation and predictive modeling, structural and non-structural. And all continue to thrive.
But there's a new twist, happening now, making this an unusually exciting time in econometrics. Predictive econometric modeling is not only alive and well, but also blossoming anew, this time at the interface of micro-econometrics and machine learning. A fine example is the new Kleinberg, Lakkaraju, Leskovic, Ludwig and Mullainathan paper, “Human Decisions and Machine Predictions”, NBER Working Paper 23180 (February 2017).
Good predictions promote good decisions, and econometrics is ultimately about helping people to make good decisions. Hence the new developments, driven by advances in machine learning, are most welcome contributions to a long and distinguished predictive econometric modeling tradition.
Monday, March 13, 2017
ML and Metrics VII: Cross-Section Non-Linearities
[Click on "Machine Learning" at right for earlier "Machine Learning and Econometrics" posts.]
The predictive modeling perspective needs not only to be respected and embraced in econometrics (as it routinely is, notwithstanding the Angrist-Pischke revisionist agenda), but also to be enhanced by incorporating elements of statistical machine learning (ML). This is particularly true for cross-section econometrics insofar as time-series econometrics is already well ahead in that regard. For example, although flexible non-parametric ML approaches to estimating conditional-mean functions don't add much to time-series econometrics, they may add lots to cross-section econometric regression and classification analyses, where conditional mean functions may be highly nonlinear for a variety of reasons. Of course econometricians are well aware of traditional non-parametric issues/approaches, especially kernel and series methods, and they have made many contributions, but there's still much more to be learned from ML.
The predictive modeling perspective needs not only to be respected and embraced in econometrics (as it routinely is, notwithstanding the Angrist-Pischke revisionist agenda), but also to be enhanced by incorporating elements of statistical machine learning (ML). This is particularly true for cross-section econometrics insofar as time-series econometrics is already well ahead in that regard. For example, although flexible non-parametric ML approaches to estimating conditional-mean functions don't add much to time-series econometrics, they may add lots to cross-section econometric regression and classification analyses, where conditional mean functions may be highly nonlinear for a variety of reasons. Of course econometricians are well aware of traditional non-parametric issues/approaches, especially kernel and series methods, and they have made many contributions, but there's still much more to be learned from ML.
Monday, March 6, 2017
ML and Metrics VI: A Key Difference Between ML and TS Econometrics
[Click on "Machine Learning" at right for earlier "Machine Learning and Econometrics" posts.]
Continuing:
So then, statistical machine learning (ML) and time series econometrics (TS) have lots in common. But there's also an interesting difference: ML's emphasis on flexible nonparametric modeling of conditional-mean nonlinearity doesn't play a big role in TS.
Of course there are the traditional TS conditional-mean nonlinearities: smooth non-linear trends, seasonal shifts, and so on. But there's very little evidence of important conditional-mean nonlinearity in the covariance-stationary (de-trended, de-seasonalized) dynamics of most economic time series. Not that people haven't tried hard -- really hard -- to find it, with nearest neighbors, neural nets, random forests, and lots more.
So it's no accident that things like linear autoregressions remain overwhelmingly dominant in TS. Indeed I can think of only one type of conditional-mean nonlinearity that has emerged as repeatedly important for (at least some) economic time series: Hamilton-style Markov-switching dynamics.
[Of course there's a non-linear elephant in the room: Engle-style GARCH-type dynamics. They're tremendously important in financial econometrics, and sometimes also in macro-econometrics, but they're about conditional variances, not conditional means.]
So there are basically only two important non-linear models in TS, and only one of them speaks to conditional-mean dynamics. And crucially, they're both very tightly parametric, closely tailored to specialized features of economic and financial data.
Now let's step back and assemble things:
ML emphasizes approximating non-linear conditional-mean functions in highly-flexible non-parametric fashion. That turns out to be doubly unnecessary in TS: There's just not much conditional-mean non-linearity to worry about, and when there occasionally is, it's typically of a highly-specialized nature best approximated in highly-specialized (tightly-parametric) fashion.
Continuing:
So then, statistical machine learning (ML) and time series econometrics (TS) have lots in common. But there's also an interesting difference: ML's emphasis on flexible nonparametric modeling of conditional-mean nonlinearity doesn't play a big role in TS.
Of course there are the traditional TS conditional-mean nonlinearities: smooth non-linear trends, seasonal shifts, and so on. But there's very little evidence of important conditional-mean nonlinearity in the covariance-stationary (de-trended, de-seasonalized) dynamics of most economic time series. Not that people haven't tried hard -- really hard -- to find it, with nearest neighbors, neural nets, random forests, and lots more.
So it's no accident that things like linear autoregressions remain overwhelmingly dominant in TS. Indeed I can think of only one type of conditional-mean nonlinearity that has emerged as repeatedly important for (at least some) economic time series: Hamilton-style Markov-switching dynamics.
[Of course there's a non-linear elephant in the room: Engle-style GARCH-type dynamics. They're tremendously important in financial econometrics, and sometimes also in macro-econometrics, but they're about conditional variances, not conditional means.]
So there are basically only two important non-linear models in TS, and only one of them speaks to conditional-mean dynamics. And crucially, they're both very tightly parametric, closely tailored to specialized features of economic and financial data.
Now let's step back and assemble things:
ML emphasizes approximating non-linear conditional-mean functions in highly-flexible non-parametric fashion. That turns out to be doubly unnecessary in TS: There's just not much conditional-mean non-linearity to worry about, and when there occasionally is, it's typically of a highly-specialized nature best approximated in highly-specialized (tightly-parametric) fashion.
Sunday, February 19, 2017
Econometrics: Angrist and Pischke are at it Again
Check out the new Angrist-Pischke (AP), "Undergraduate Econometrics Instruction: Through Our Classes, Darkly".
I guess I have no choice but to weigh in. The issues are important, and my earlier AP post, "Mostly Harmless Econometrics?", is my all-time most popular.
Basically AP want all econometrics texts to look a lot more like theirs. But their books and their new essay unfortunately miss (read: dismiss) half of econometrics.
Here's what AP get right:
(Goal G1) One of the major goals in econometrics is predicting the effects of exogenous "treatments" or "interventions" or "policies". Phrased in the language of estimation, the question is "If I intervene and give someone a certain treatment \({\partial x}, x \in X\), what is my minimum-MSE estimate of her \(\ \partial y\)?" So we are estimating the partial derivative \({\partial y / \partial x}\).
AP argue the virtues and trumpet the successes of a "design-based" approach to G1. In my view they make many good points as regards G1: discontinuity designs, dif-in-dif designs, and other clever modern approaches for approximating random experiments indeed take us far beyond "Stones'-age" approaches to G1. (AP sure turn a great phrase...). And the econometric simplicity of the design-based approach is intoxicating: it's mostly just linear regression of \(y\) on \(x\) and a few cleverly-chosen control variables -- you don't need a full model -- with White-washed standard errors. Nice work if you can get it. And yes, moving forward, any good text should feature a solid chapter on those methods.
Here's what AP miss/dismiss:
(Goal G2) The other major goal in econometrics is predicting \(y\). In the language of estimation, the question is "If a new person \(i\) arrives with covariates \(X_i\), what is my minimum-MSE estimate of her \(y_i\)? So we are estimating a conditional mean \(E(y | X) \), which in general is very different from estimating a partial derivative \({\partial y / \partial x}\).
The problem with the AP paradigm is that it doesn't work for goal G2. Modeling nonlinear functional form is important, as the conditional mean function \(E(y | X) \) may be highly nonlinear in \(X\); systematic model selection is important, as it's not clear a priori what subset of \(X\) (i.e., what model) might be most useful for approximating \(E(y | X) \); detecting and modeling heteroskedasticity is important (in both cross sections and time series), as it's the key to accurate interval and density prediction; detecting and modeling serial correlation is crucially important in time-series contexts, as "the past" is the key conditioning information for predicting "the future"; etc., etc, ...
I guess I have no choice but to weigh in. The issues are important, and my earlier AP post, "Mostly Harmless Econometrics?", is my all-time most popular.
Basically AP want all econometrics texts to look a lot more like theirs. But their books and their new essay unfortunately miss (read: dismiss) half of econometrics.
Here's what AP get right:
(Goal G1) One of the major goals in econometrics is predicting the effects of exogenous "treatments" or "interventions" or "policies". Phrased in the language of estimation, the question is "If I intervene and give someone a certain treatment \({\partial x}, x \in X\), what is my minimum-MSE estimate of her \(\ \partial y\)?" So we are estimating the partial derivative \({\partial y / \partial x}\).
AP argue the virtues and trumpet the successes of a "design-based" approach to G1. In my view they make many good points as regards G1: discontinuity designs, dif-in-dif designs, and other clever modern approaches for approximating random experiments indeed take us far beyond "Stones'-age" approaches to G1. (AP sure turn a great phrase...). And the econometric simplicity of the design-based approach is intoxicating: it's mostly just linear regression of \(y\) on \(x\) and a few cleverly-chosen control variables -- you don't need a full model -- with White-washed standard errors. Nice work if you can get it. And yes, moving forward, any good text should feature a solid chapter on those methods.
Here's what AP miss/dismiss:
(Goal G2) The other major goal in econometrics is predicting \(y\). In the language of estimation, the question is "If a new person \(i\) arrives with covariates \(X_i\), what is my minimum-MSE estimate of her \(y_i\)? So we are estimating a conditional mean \(E(y | X) \), which in general is very different from estimating a partial derivative \({\partial y / \partial x}\).
The problem with the AP paradigm is that it doesn't work for goal G2. Modeling nonlinear functional form is important, as the conditional mean function \(E(y | X) \) may be highly nonlinear in \(X\); systematic model selection is important, as it's not clear a priori what subset of \(X\) (i.e., what model) might be most useful for approximating \(E(y | X) \); detecting and modeling heteroskedasticity is important (in both cross sections and time series), as it's the key to accurate interval and density prediction; detecting and modeling serial correlation is crucially important in time-series contexts, as "the past" is the key conditioning information for predicting "the future"; etc., etc, ...
(Notice how often "model" and "modeling" appear in the above paragraph. That's precisely what AP dismiss, even in their abstract, which very precisely, and incorrectly, declares that "Applied econometrics ...[now prioritizes]... the estimation of specific causal effects and empirical policy analysis over general models of outcome determination".)
The AP approach to goal G2 is to ignore it, in a thinly-veiled attempt to equate econometrics exclusively with G1, which nicely feathers the AP nest. Sorry guys, but no one's buying it. That's why the textbooks continue to feature G2 tools and techniques so prominently, as well they should.
The AP approach to goal G2 is to ignore it, in a thinly-veiled attempt to equate econometrics exclusively with G1, which nicely feathers the AP nest. Sorry guys, but no one's buying it. That's why the textbooks continue to feature G2 tools and techniques so prominently, as well they should.
Monday, November 7, 2016
Big Data for Volatility vs.Trend
Although largely uninformative for some purposes, dense data (high-frequency sampling) are highly informative for others. The massive example of recent decades is volatility estimation. The basic insight traces at least to Robert Merton's early work. Roughly put, as we sample returns arbitrarily finely, we can infer underlying volatility (quadratic variation) arbitrarily well.
So, what is it for which dense data are "largely uninformative"? The massive example of recent decades is long-term trend. Again roughly put and assuming linearity, long-term trend is effectively a line segment drawn between a sample's first and last observations, so for efficient estimation we need tall data (long calendar span), not dense data.
Assembling everything, for estimating yesterday's stock-market volatility you'd love to have yesterday's 1-minute intra-day returns, but for estimating the expected return on the stock market (the slope of a linear log-price trend) you'd much rather have 100 years of annual returns, despite the fact that a naive count would say that 1 day of 1-minute returns is a much "bigger" sample.
So different aspects of Big Data -- in this case dense vs. tall -- are of different value for different things. Dense data promote accurate volatility estimation, and tall data promote accurate trend estimation.
So, what is it for which dense data are "largely uninformative"? The massive example of recent decades is long-term trend. Again roughly put and assuming linearity, long-term trend is effectively a line segment drawn between a sample's first and last observations, so for efficient estimation we need tall data (long calendar span), not dense data.
Assembling everything, for estimating yesterday's stock-market volatility you'd love to have yesterday's 1-minute intra-day returns, but for estimating the expected return on the stock market (the slope of a linear log-price trend) you'd much rather have 100 years of annual returns, despite the fact that a naive count would say that 1 day of 1-minute returns is a much "bigger" sample.
So different aspects of Big Data -- in this case dense vs. tall -- are of different value for different things. Dense data promote accurate volatility estimation, and tall data promote accurate trend estimation.
Monday, October 31, 2016
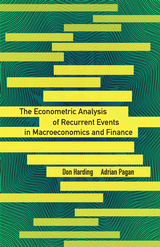
Econometric Analysis of Recurrent Events
Monday, October 24, 2016
Machine Learning vs. Econometrics, IV
Some of my recent posts on this topic emphasized that (1) machine learning (ML) tends to focus on non-causal prediction, whereas econometrics and statistics (E/S) has both non-causal and causal parts, and (2) E/S tends to be more concerned with probabilistic assessment of forecast uncertainty. Here are some related thoughts.
As for (1), it's wonderful to see the ML and E/S literatures beginning to cross-fertilize, driven in significant part by E/S. Names like Athey, Chernozukov, and Imbens come immediately to mind. See, for example, the material here under "Econometric Theory and Machine Learning", and here under "Big Data: Post-Selection Inference for Causal Effects" and "Big Data: Prediction Methods".
As for (2) but staying with causal prediction, note that the traditional econometric approach treats causal prediction as an estimation problem (whether by instrumental variables, fully-structural modeling, or whatever...) and focuses not only on point estimates, but also on inference (standard errors, etc.) and hence implicitly on interval prediction of causal effects (by inverting the test statistics). Similarly, the financial-econometric "event study" approach, which directly compares forecasts of what would have happened in the absence of an intervention to what happened with the intervention, also focuses on inference for the treatment effect, and hence implicitly on interval prediction.
Sunday, October 16, 2016
Machine Learning vs. Econometrics, III
I emphasized here that both machine learning (ML) and econometrics (E) prominently feature prediction, one distinction being that ML tends to focus on non-causal prediction, whereas a significant part of E focuses on causal prediction. So they're both focused on prediction, but there's a non-causal vs. causal distinction. [Alternatively, as Dean Foster notes, you can think of both ML and E as focused on estimation, but with different estimands. ML tends to focus on estimating conditional expectations, whereas the causal part of E focuses on estimating partial derivatives.]
In any event, there's another key distinction between much of ML and Econmetrics/Statistics (E/S): E/S tends to be more concerned with probabilistic assessment of uncertainty. Whereas ML is often satisfied with point forecasts, E/S often wants interval, and ultimately density, forecasts.
There are at least two classes of reasons for the difference.
First, E/S recognizes that uncertainty is often of intrinsic economic interest. Think market risk, credit risk, counter-party risk, systemic risk, inflation risk, business cycle risk, etc.
Second, E/S is evidently uncomfortable with ML's implicit certainty-equivalence approach of simply plugging point forecasts into decision rules obtained under perfect foresight. Evidently the linear-quadratic-Gaussian world in which certainty equivalence holds resonates less than completely with E/S types. That sounds right to me. [By the way, see my earlier piece on optimal prediction under asymmetric loss.]
In any event, there's another key distinction between much of ML and Econmetrics/Statistics (E/S): E/S tends to be more concerned with probabilistic assessment of uncertainty. Whereas ML is often satisfied with point forecasts, E/S often wants interval, and ultimately density, forecasts.
There are at least two classes of reasons for the difference.
First, E/S recognizes that uncertainty is often of intrinsic economic interest. Think market risk, credit risk, counter-party risk, systemic risk, inflation risk, business cycle risk, etc.
Second, E/S is evidently uncomfortable with ML's implicit certainty-equivalence approach of simply plugging point forecasts into decision rules obtained under perfect foresight. Evidently the linear-quadratic-Gaussian world in which certainty equivalence holds resonates less than completely with E/S types. That sounds right to me. [By the way, see my earlier piece on optimal prediction under asymmetric loss.]
Subscribe to:
Posts (Atom)