Tufte always says that Minard's Napoleon's March graphic, above, is the greatest ever. (Click here for detail.) Everyone else says that too, but they're just repeating Tufte. Notwithstanding the futility of "greatest ever" proclamations (except for rock guitarists -- it's clearly Jimmy Page, but that's another post...), Tufte might be right. Napoleon's March informs instantly, yet it simultaneously repays hours of careful scrutiny. It shows the French army advancing on Moscow (brown) and retreating due to the brutal winter (black), with path widths tracking the number of soldiers alive. It presents a huge amount of information compactly, telling a rich and textured story moving through space and time, beginning with bravado and devolving into disaster.
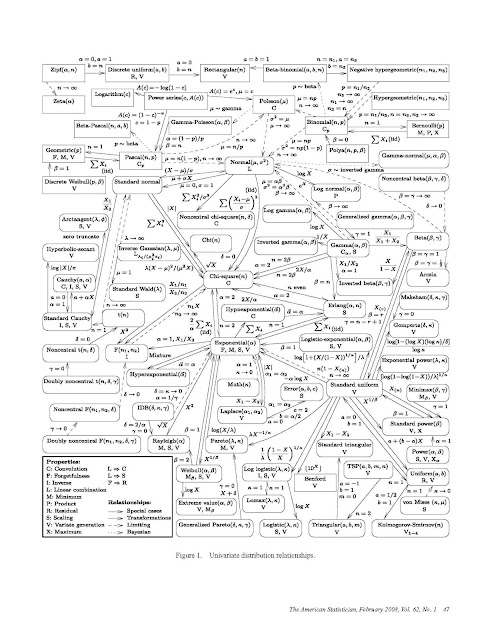
Now consider the Univariate Distributional Relationships graphic below, by Larry Leemis et al. (American Statistician, 2008). I learned of it recently from Oscar Jorda and Glenn Rudebusch, two fine and graphics-aware economics researchers. At first I thought it was a joke, a great example of in-your-face bad graphics, perhaps entertaining (unintentionally) but failing to communicate seriously. A better title, I thought, would be Nightmares of the Statistical Jungle.
Interestingly, consideration of Minard's Napoleon vs. Leemis et al.'s Distributions raises important and unresolved issues. Tufte's main mission is to describe how best to make "traditional" graphics, frozen on the static printed page, as with Minard's Napoleon, and his descriptions are of course also frozen on the same static printed page. But in recent decades the computer has catapulted us to dynamic and multi-layered graphics, with highlighting, brushing, spinning, clicking, etc., as with Leemis et al.'s dynamic Distributions. What are the key new principles of dynamic graphics, and how can one possibly describe them well in print? Tufte shrewdly skirts those issues in large part, leaving it to others to write a new "Tufte for the 21st Century." Pioneers like William S. Cleveland and his group at Bell Labs made early progress, and of course the modern dynamic graphics research program continues unabated. But it's still hard -- and it will always be hard -- to describe and discuss dynamic graphics insightfully on paper.
Will there ever be a Tufte for the 21st Century? Is it even possible? What would be its format? (Surely not paper.) And what, precisely, would it contain? The good news, I suppose, is that we have 87 years to continue working on it.


No comments:
Post a Comment
Note: Only a member of this blog may post a comment.