Econometrics, economics, finance, random rants.

Econometrics, economics, finance, random rants...

Monday, July 29, 2013

More on the Strange American Estimator: GMM, Simulation, and Misspecification

What's so interesting, then, about GMM? For me there are two key things: its implementation by simulation, and its properties under misspecification.

First consider the implementation of GMM by simulation (so-called simulated method of moments, SMM).

GMM is widely-advertised as potentially useful when a likelihood is unavailable. In other cases the likelihood may be "available" but very difficult to derive or evaluate. But model moments may also be seemingly unavailable (i.e., analytically intractable). SMM recognizes that model moments are effectively never intractable, because they can be calculated arbitrarily accurately from an arbitrarily long model simulation. That's really exciting, because simulation ability is a fine litmus test of model understanding. If you can't figure out how to simulate pseudo-data from a given probabilistic model, then you don't really understand the model (or the model is ill-posed). Assembling everything: If you understand a model you can simulate it, and if you can simulate it you can estimate it consistently by SMM, choosing parameters to minimize divergence between data moments and (simulated) model moments. Eureka! No need to work out complex likelihoods, even if they are in principle "available," and in this age of Big Data, MLE efficiency lost may be a small price for SMM tractability gained.

Now consider the properties of GMM/SMM under misspecification, which is what intrigues me the most.

All econometric models are approximations to a true but unknown data-generating process (DGP), and hence likely misspecified. GMM/SMM has special appeal from that perspective. Under correct specification any consistent estimator (e.g., MLE or GMM/SMM) unambiguously gets you to the right place asymptotically, and MLE has the extra benefit of efficiency, so it's preferable. But under misspecification, consistency distinguishes the estimators, quite apart from the secondary issue of efficiency. In particular, under misspecification the best asymptotic DGP approximation for one purpose may be very different from the best for another. GMM/SMM is appealing in such situations, because it forces you to think about which features of the data (moments, M) you'd like to match, and then by construction it's consistent for the M-optimal approximation.

In contrast to GMM/SMM, pseudo-MLE ties your hands. Gaussian pseudo-MLE, for example, may be consistent for the KLIC-optimal approximation, but KLIC optimality may not be of maximal relevance. From a predictive perspective, for example, the KLIC-optimal approximation minimizes 1-step-ahead mean-squared prediction error, but 1-step quadratic loss may not be the relevant loss function. The bottom line: under misspecification MLE may not be consistent for what you want, whereas by construction GMM is consistent for what you want (once you decide what you want).

So, at least in part, GMM/SMM continues to intrigue me. It's hard to believe that it's been three decades since Lars Hansen's classic GMM paper (1982, Econometrica), and two decades since the similarly-classic indirect inference papers of Tony Smith (1990, Duke Ph.D. Dissertation, and 1993, J. Applied Econometrics) and Christian GourierouxAlain Monfort and Eric Renault (1993, J. Applied Econometrics). (SMM is a special case of indirect inference.) If by now the Hansen-Smith-Gourieroux-Monfort-Renault insights seem obvious, it's only because many good insights are obvious, ex post.

Monday, July 22, 2013

GMM, the "Strange American Estimator"

At three separate recent non-American conferences, I heard three separate European econometricians refer to generalized method of moments (GMM) as a "strange American estimator." Needless to say, that raised my eyebrows. One doesn't hear that phrase too often in, say, Stanford or Chicago or Cambridge (Massachusetts, that is).

Although I am American, I have some sympathy for the European view (if I may be so bold as to assert that my sample of size three has indeed uncovered a "view"). I may even have significantly more sympathy than do most Americans.  But ultimately my feelings are mixed.

On the one hand, it seems clear that frequentist statisticians dismissed method-of-moments and minimum chi-squared (their term for GMM) ages ago as inefficient relative to MLE, and that Bayesian statisticians never dismissed them because they never paid them any attention in the first place. Instead, both communities have always thoroughly and intentionally focused on the likelihood -- frequentists on the location of its max and its curvature in an epsilon-neighborhood of the max, and Bayesians on its entire shape.

Surely this historical background is what drives the European view.  And against that background, I too am always a bit perplexed by the GMM phenomenon, as distilled for example in Hayashi's classic econometrics text, which reads in significant part as something of a prayer book for the GMM congregation. (Never mind that my friend and former-colleague Hayashi is Japanese; his econometrics training and style are thoroughly American.)

That is, I must admit that, in part, I too am rather skeptical. Somehow my community just never got the religion. My belief is probably restrained significantly by the fact that my interest centers on dynamic predictive econometric modeling, which is often best done in reduced-form (see No Hesitations, June 12, 2013). Hence one of the grand sources of GMM moment conditions -- orthogonality between instruments and disturbances in estimating causal effects -- is, for me, typically neither here nor there.

On the other hand, my sympathy for the European view is far from complete. For example, some important classes of economic models produce moment restrictions but not full likelihoods. Despite the GMM crowd's repeating that mantra ad nauseum, it's as true now as ever. But if the story of GMM's appeal ended with its usefulness when a model fails to produce a likelihood, I'd be underwhelmed. Maybe I'd even move to Europe.

What then do I find so additionally impressive about GMM?  Stay tuned for the next post.

Tuesday, July 16, 2013

The Latest in Statistical Graphics

In a recent gushing review, The Economist made Data Points: Visualization that Means Something by Nathan Yau (Wiley, 2013) sound like the elusive "Tufte for the 21st-Century" discussed in an earlier post (Statistical Graphics: The Good, The Bad, and the Ugly, June 21, 2013). Alas, it's not. Much of it is just inferior re-hash of old 20th-century Tufte. Nevertheless I like it and I'm glad I bought it. Among other things, there are some really cute examples, like this one showing the available colors of Crayola crayons over time.

Published by Stephen Von Worley. Designed by Velociraptor. See links below.

(Yes, I know it's not original to Yau, and I know it's comparatively easy to use clever color in a Crayola graphic, but still...) Crayola also brings back good memories: I was a user/fan in the 64-color days of 1958-1972, not only for the awesome 64 colors but also for the totally-cool tiered box with built-in sharpener!

Perhaps most interesting is Yau's final chapter, where he offers opinions on graphics software environments. (After all, he spends his life doing this stuff, so it's interesting to learn his preferences.) At a high "canned" level, he likes Tableau, the "Tableau Public" version of which is free. Well, nothing is really free, and Tableau Public follows an interesting paradigm: the price of using the web-based software is that users must upload their data so that others can use it.

But readers of this blog will be more interested in lower-level scientific software that allows for significant graph customization.  In that regard, and not surprisingly, Yau is an R fan. (See my earlier post, Research Computing / Data / Writing Environments, May 31, 2013.) He basically does all his graphics in R, but quite interestingly, he doesn't like to tune his graphs completely in R. Instead, he finalizes them using illustration software like the open-source Inkscape. Hmmm...

Yau's book also introduced me to his blog, FlowingData, which is interesting and entertaining. Also see Data Pointed, a fine blog by scientist and artist Sephen Von Worley, the author of the Crayola graphic above. And if you're really a Crayola maven, see his post, Somewhere Over the Crayon-Bow.

Finally, and ironically, the most interesting thing about Yau's book is not explicitly discussed in it, yet it lurks massively throughout: Big Data and its interaction with graphics. More on that soon.

Wednesday, July 10, 2013

Financial Regulation, Part Three: The Known, the Unknown and the Unknowable

Dick Herring, Neil Doherty and I recently worked on an eye-opening research project that resulted in our book, The Known, the Unknown and the Unknowable in Financial Risk Management. I always liked the cover art (thanks to Princeton University Press, which did its usual fine job throughout).  I feel bad for the poor guy in the necktie, in the maze. But that's life in financial markets.

bookjacket

Poor Little Guy

We abbreviate the known, the unknown and the unknowable by K, u and U, respectively. Roughly, K is risk (known outcomes, known probabilities), u is uncertainty (known outcomes, unknown probabilities), and U is ignorance (unknown outcomes, unknown probabilities).

The book blurb on my web page reads as follows:

"On the successes and failures of various parts of modern financial risk management, emphasizing the known (K), the unknown (u) and the unknowable (U). We illustrate a KuU-based perspective for conceptualizing financial risks and designing effective risk management strategies. Sometimes we focus on K, and sometimes on U, but most often our concerns blend aspects of K and u and U. Indeed K and U are extremes of a smooth spectrum, with many of the most interesting and relevant situations interior."

The blurb continues:

"Statistical issues emerge as central to risk measurement, and we push toward additional progress. But economic issues of incentives and strategic behavior emerge as central for risk management, as we illustrate in a variety of contexts."

The book's table of contents reveals the breadth of that insight, from risk management, asset allocation, and asset pricing, to insurance, crisis management, real estate, corporate governance, monetary policy, and private investing:

TABLE OF CONTENTS

Chapter 1: Introduction by Francis X. Diebold, Neil A. Doherty, and Richard J. Herring 1

Chapter 2: Risk: A Decision Maker's Perspective by Sir Clive W. J. Granger 31

Chapter 3: Mild vs. Wild Randomness: Focusing on Those Risks That Matter by Benoit B. Mandelbrot and Nassim Nicholas Taleb 47

Chapter 4: The Term Structure of Risk, the Role of Known and Unknown Risks, and Nonstationary Distributions by Riccardo Colacito and Robert F. Engle 59

Chapter 5: Crisis and Non-crisis Risk in Financial Markets: A Unified Approach to Risk Management by Robert H. Litzenberger and David M. Modest 74

Chapter 6: What We Know, Don't Know, and Can't Know about Bank Risk: A View from the Trenches by Andrew Kuritzkes and Til Schuermann 103

Chapter 7: Real Estate through the Ages: The Known, the Unknown, and the Unknowable by Ashok Bardhan and Robert H. Edelstein 145

Chapter 8: Reflections on Decision-making under Uncertainty by Paul R. Kleindorfer 164

Chapter 9: On the Role of Insurance Brokers in Resolving the Known, the Unknown, and the Unknowable by Neil A. Doherty and Alexander Muermann 194

Chapter 10: Insuring against Catastrophes by Howard Kunreuther and Mark V. Pauly 210

Chapter 11: Managing Increased Capital Markets Intensity: The Chief Financial Officer's Role in Navigating the Known, the Unknown, and the Unknowable by Charles N. Bralver and Daniel Borge 239

Chapter 12: The Role of Corporate Governance in Coping with Risk and Unknowns by Kenneth E. Scott 277

Chapter 13: Domestic Banking Problems by Charles A. E. Goodhart 286

Chapter 14: Crisis Management: The Known, The Unknown, and the Unknowable by Donald L. Kohn 296

Chapter 15: Investing in the Unknown and Unknowable by Richard J. Zeckhauser 304


I say that the project was "eye opening" (for me) because I went into it thinking about econometrics, but I came out of it thinking about economics.  Econometrics is invaluable for risk measurement, systemic aspects of which are embodied for example in the Diebold-Yilmaz network connectedness framework, or in parts of Rob Engle's V-Lab. But risk management, in particular risk prevention, is equally (or more) about creating incentives to guide strategic behavior, particularly in situations of u and U.

The real question, then, is how to write contracts (design organizations, design policies, design
rules) that incent firms to "do the right thing," whatever that might mean, in myriad situations, many of which may be inconceivable at present -- that is, across the KuU spectrum.

How to do it?

To be continued...

Tuesday, July 2, 2013

Financial Regulation, Part Two: Rules

I concluded lmy last post with the question, "Do you really believe that ... this time we've fixed the too-big-to-fail (TBTF) incentive problem, that this time is different?" Presumably your answer depends on your feelings regarding the efficacy of Dodd-Frank's (DF's) increased capital requirements and intensified scrutiny of financial institutions.

Needless to say, I have my doubts.

Left to their own devices, lawyerly types (and politicians and regulators come disproportionately from that realm) tend to aspire to write exhaustive sets of rules that dictate what can and can't be done, when, and by whom. Economists call that a "complete contract." DF, at 2000+ pages, is an example of an attempt at such a complete contract, which financial institutions were forced to "sign."

One can entertain the idea of a complete contract in principle, but the idea of making rules to govern all possible contingencies is preposterous in practice. (Note that many important possible contingencies are surely not even remotely conceivable now -- more on that in the next post.) No one is so naive as to believe that DF is truly a complete contract, but the spirit of the attempt is one of complete contracting. Let's call it "rules-based" regulation.

Of course all legislation, regulatory or otherwise, must be rules-based. Rules, after all, are the essence of law. And rules, even massive sets of rules, can be very good things. There is little doubt, for example, that rules enforcing contractual and property rights can play a large role in generating economic prosperity. And there are some good entries in the DF rulebook.

But there are three key related problems with naive implementations of rules-based regulation, and it's important to be aware of them vis-à-vis DF. First, naive rules-based regulation is mostly backward-looking, effectively regulating earlier crises, with potentially very little relevance for future crises. It's terribly hard, as they say, to drive forward when looking only in the rear-view mirror. When the next major financial crisis hits, it will likely arrive via avenues that DF missed, and then DF will be augmented with another 2000+ pages of rules looking backward at that crisis, and so on, and on and on.

Second, naive rules-based regulation invites regulatory arbitrage. That is, as soon as rules are announced, firms start devising ways to skirt them. Indeed modern finance is in many respects an industry of very smart people whose job, for a given set of rules, is to work furiously to reverse-engineer those rules (they're doing it right now with respect to DF), devising clever ways to legally bear as much risk as possible while holding as little capital as possible, by finding and taking risks missed by the rules.

Third, naive rules-based regulation invites regulatory capture. That is, the regulated and the regulators get cozy, and the regulated eventually "capture" the regulator. First the regulators and regulated work side by side, implicitly or explicitly as in DF. Next the regulated are making "suggestions" for creative rule interpretation. Before long the regulated are helping to write the rules, crafting the very loopholes that they'll later exploit.

What to do? How to deal with the fundamental incompleteness of the regulatory contract? More specifically, given the long-term impotence of naive implementations of rules-based regulation, how really to thwart the adverse incentives of TBTF? If rules are unavoidable, and if naive rule implementations are problematic, are there better, sophisticated, implementations?

To be continued...

Wednesday, June 26, 2013

Financial Regulation, Part One: Too Big to Fail

I promised not to torture you with boring policy drivel ("Questions," May 17, 2013). What follows is about financial regulatory policy, but I insist that it's neither boring nor drivel. Rather it's about a key and deep issue.

Let's get right to it. The massive elephant in the room is, and always has been, the free insurance, or the free put option, or the bailout entitlement -- call it whatever you want -- associated with financial institutions with the coveted status of "too big to fail" (TBTF). Rest assured, there's no better way to incent financial institutions to take massively undesirable risks, with disastrous macroeconomic consequences, than to give them "get of of jail free" cards.

Effete cognoscenti will yawn and note that this is hardly a new observation. They're right. Countless observers have been shouting for decades about the adverse incentives generated by TBTF. Gary Stern, former President of the Federal Reserve Bank of Minneapolis, and David Skeel, Professor of Law at the University of Pennsylvania, are two good examples. Take a look at their books here (Stern) and here (Skeel).

The problem is that the shouts have fallen on largely deaf legislative ears. Indeed Dodd-Frank effectively institutionalizes TBTF through a nasty cocktail of government "partnership" with financial institutions, combined with discretionary government distress-resolution procedures. A nightmare scenario if ever there was.

The same cognoscenti will now snap to attention and assert that Dodd-Frank recognizes TBTF's adverse incentives and thwarts them by increasing capital requirements and intensifying regulatory scrutiny. TBTF is no longer relevant, the story goes, because now we're regulating the large institutions so effectively that they'll never again be in danger of failing.

Do you really believe that? That is, is there any real reason to believe that this time the rain dance will work, that this time we've fixed the TBTF incentive problem, that this time is different?

To be continued...

Friday, June 21, 2013

Statistical Graphics: The Good, The Bad, and the Ugly

I love good graphics, so I love Edward Tufte's work, and I'm always amazed by the number of allegedly quant-aware people who are actually unaware of Tufte. His beautifully-produced first book, The Visual Display of Quantitative Information, is surely the all-time masterpiece on elements of graphical style, not to mention a tremendously engaging and entertaining read. He opened my eyes, massively, to everything from avoiding chartjunk (a marvelous Tufte term), to thinking hard about aspect ratios, to thinking similarly hard about whether/why/how to use color. Indeed I admire Tufte so much that I occasionally find myself jealous. Why can't I be Tufte? Why can't I be the graphics legend with the stunning ET Modern studio in Manhattan? Why didn't Apple ask me to design the iPhone GUI? Damn that miserable Tufte.


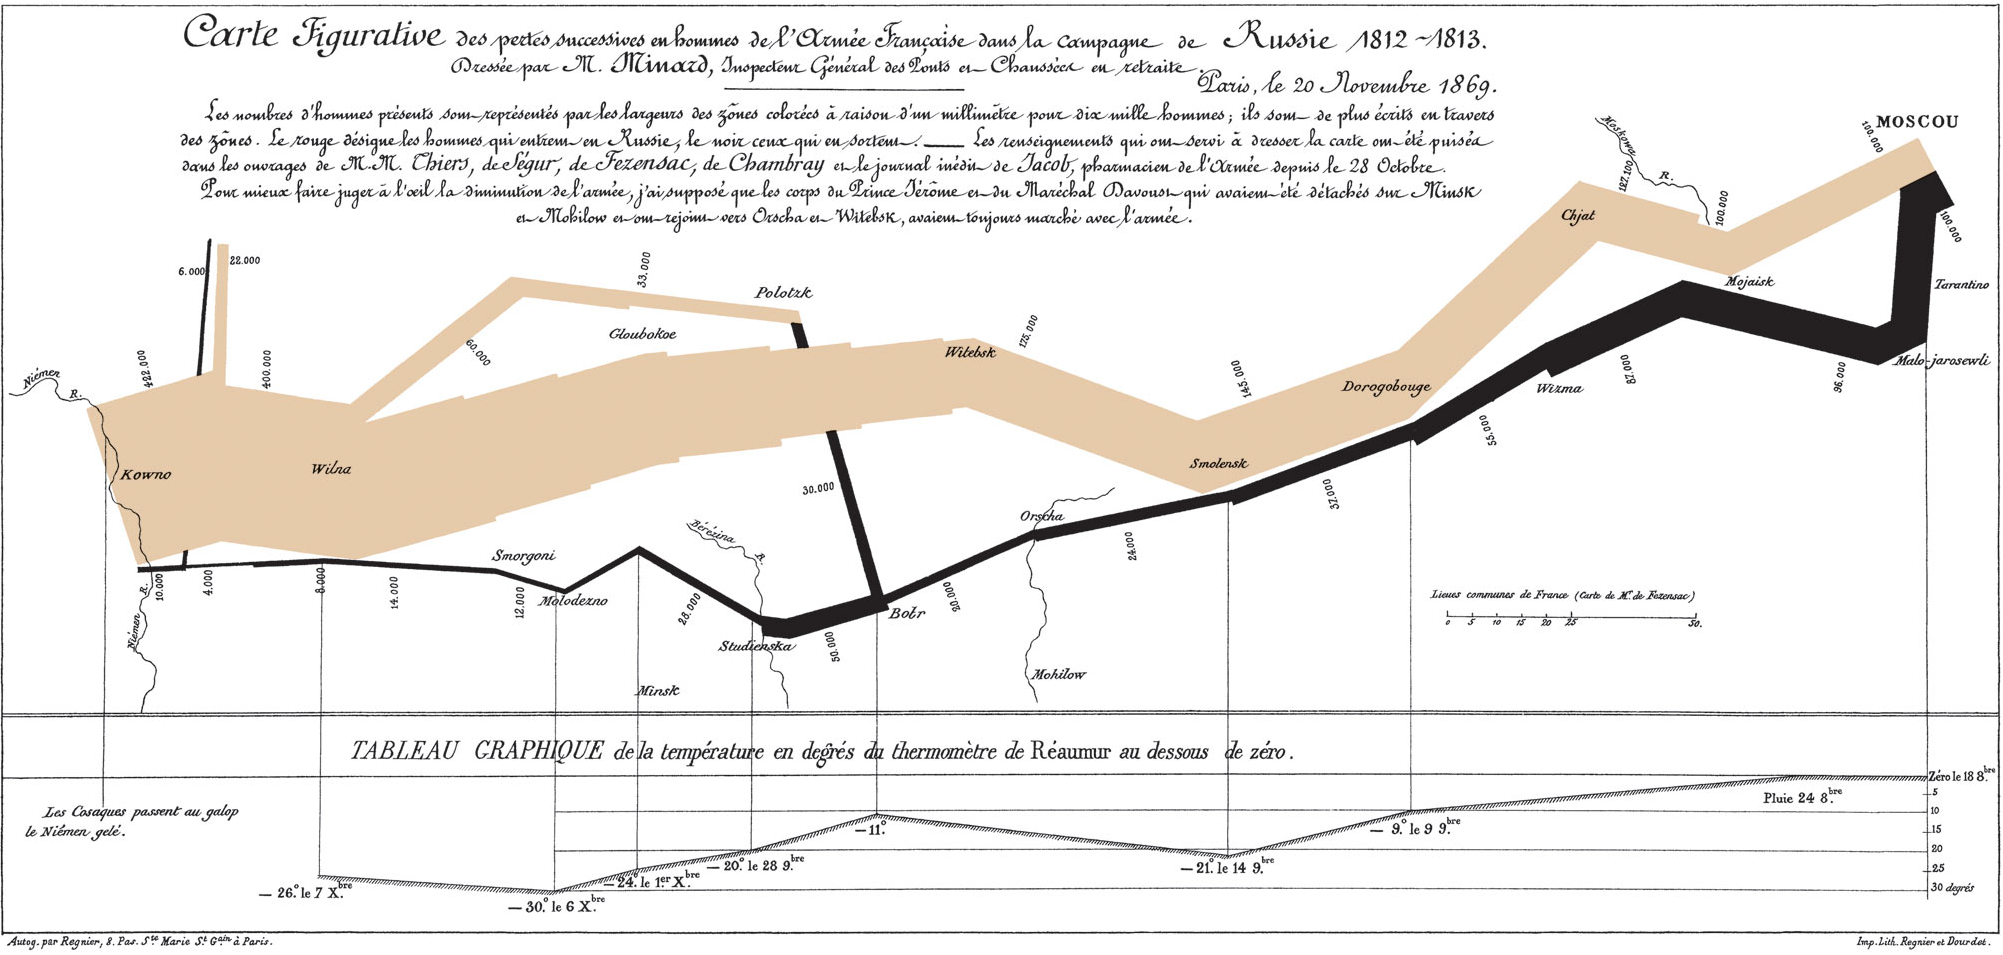
Tufte always says that Minard's Napoleon's March graphic, above, is the greatest ever. (Click here for detail.) Everyone else says that too, but they're just repeating Tufte. Notwithstanding the futility of "greatest ever" proclamations (except for rock guitarists -- it's clearly Jimmy Page, but that's another post...), Tufte might be right. Napoleon's March informs instantly, yet it simultaneously repays hours of careful scrutiny. It shows the French army advancing on Moscow (brown) and retreating due to the brutal winter (black), with path widths tracking the number of soldiers alive. It presents a huge amount of information compactly, telling a rich and textured story moving through space and time, beginning with bravado and devolving into disaster. 

Now consider the Univariate Distributional Relationships graphic below, by Larry Leemis et al. (American Statistician, 2008). I learned of it recently from Oscar Jorda and Glenn Rudebusch, two fine and graphics-aware economics researchers. At first I thought it was a joke, a great example of in-your-face bad graphics, perhaps entertaining (unintentionally) but failing to communicate seriously. A better title, I thought, would be Nightmares of the Statistical Jungle.

Now, a week later, I feel, well, the same.  But I've also come to view the American Statistician version of Leemis et al. as something of a static straw man, chained as it is to the printed page. It turns out that the Leemis et al. web page has a much better dynamic version. Moving the mouse over the graphic, each distribution is highlighted, together with its immediate relatives. And moving the mouse over any of the distributions listed on the left of the web page locates it and its relatives in the figure, and clicking provides more detailed information. All told, the dynamic version of Leemis et al. is engaging and useful.

Interestingly, consideration of Minard's Napoleon vs. Leemis et al.'s Distributions raises important and unresolved issues. Tufte's main mission is to describe how best to make "traditional" graphics, frozen on the static printed page, as with Minard's Napoleon, and his descriptions are of course also frozen on the same static printed page. But in recent decades the computer has catapulted us to dynamic and multi-layered graphics, with highlighting, brushing, spinning, clicking, etc., as with Leemis et al.'s dynamic Distributions. What are the key new principles of dynamic graphics, and how can one possibly describe them well in print? Tufte shrewdly skirts those issues in large part, leaving it to others to write a new "Tufte for the 21st Century." Pioneers like William S. Cleveland and his group at Bell Labs made early progress, and of course the modern dynamic graphics research program continues unabated. But it's still hard -- and it will always be hard -- to describe and discuss dynamic graphics insightfully on paper.

Will there ever be a Tufte for the 21st Century? Is it even possible? What would be its format? (Surely not paper.) And what, precisely, would it contain? The good news, I suppose, is that we have 87 years to continue working on it.

Wednesday, June 12, 2013

Structural Models, Reduced-Form Models, and Financial Econometrics

The scene at SoFiE 2013 leads me to reflect on structural vs. reduced-form modeling approaches in econometrics. Much financial-econometric work is reduced-form, whereas structural modeling has recently become fashionable in certain other areas of econometrics. The structure police, especially new recruits, are often fanatical.  But the reality is that reduced-form "statistical" models are every bit as scientific as structural models. Structural models are simply restricted reduced-form models, and it's a delicate and situation-specific matter as to whether imposing structural restrictions on reduced forms is necessary or desirable.

Many central activities in finance involve descriptive and predictive tasks, which are often most effectively executed in reduced-form mode. That is, we don't necessarily need deep structural understanding to succeed, for example, at prediction, which is wonderful, because we often don't have deep structural understanding. (Admit it.)

One key example, on my mind because it features prominently at SoFiE, is financial market volatility modeling.  GARCH, stochastic volatility, realized volatility, whatever -- all such approaches are reduced-form, essentially autoregressive. Yet financial econometric volatility modeling has been hugely successful in both academic and industrial finance. It is now used routinely and productively in risk management, portfolio management, spot and derivative asset pricing, and more.

And financial econometric volatility modeling is just one example. All told, for descriptive and predictive tasks in a variety of sub-areas of econometrics, reduced-form modeling often provides the best of all worlds, delivering major advances while avoiding structural modeling pitfalls.

Wednesday, June 5, 2013

SoFiE 2013 Singapore


Greetings my friends, en route to SoFiE's annual meeting, in Singapore this time. If you're new to the Society for Financial Econometrics (SoFiE) (and even if you're not), please take a look and click on the links.

SoFiE is a global network of academics and practitioners dedicated to sharing research and ideas in the fast-growing field of financial econometrics. It's an independent non-profit membership organization (check out the governing Council), committed to promoting and expanding research and education by organizing and sponsoring conferences, programs and activities at the intersection of finance and econometrics, including links to macroeconomic fundamentals. Its official journal is the Journal of Financial Econometrics, published by Oxford University Press.

The annual SoFiE meetings rotate among the Americas, Europe and Asia and feature all aspects of financial econometrics. This our sixth annual meeting, so we've now been around the world twice: New York, Geneva, Melbourne, Chicago, Oxford and now Singapore. Check out the Singapore program and plenary speakers. We are most grateful for the impressive efforts of this year's local organizers, Jin-Chuan Duan and his fine team at National University of Singapore, and Jun Yu and his fine team at Singapore Management University. Jin-Chuan Duan leads the  Risk Management Institute at NUS, and Jun Yu leads the Sim Kee Boon Institute for Financial Economics at SMU.

Check out the SoFiE Facebook group, and visit its web page.  You'll see other SoFiE activities as well.  They include regional thematic SoFiE meetings (the last was at FGV Rio de Janeiro in December 2012, and the next is  in Lugano in October 2013 on large-scale factor models, hosted by the University of Lugano -- more precisely The Faculty of Economics of the Università della Svizzera Italiana -- with additional sponsorship from the Swiss Finance Institute).  SoFiE activities also include the annual OMI-SoFiE Financial Econometrics Summer School, thanks to Neil Shephard's entrepreneurship (the last was July 2012 in Oxford at the Oxford-Man Institute (OMI), as is the next, July 2013 on Financial Forecasting featuring Andrew Patton and Allan Timmermann).  

On the web page you'll also find information about membership. The Society benefits from the invaluable support of both a core group of institutional members and hundreds of individual members. Please consider joining the Society. We'd love to have you!

Saturday, June 1, 2013

Blogging Environments

Speaking of ideal environments, how could I have forgotten blogging environments in my last post?

Not that I really know much. And not that you care. Anyway, a typical recent Diebold family exchange says it all:

Daughter 1: Dad, why are you doing a stupid blog?

Me: I'm not sure. And it's not stupid. And thanks for your support.

Daughter 1: And why are you doing your stupid blog using stupid Google Blogger?

Me: I'm not sure. And thanks for your support.

Daughter 1: No cool bloggers use Blogger. Only old people who don't know any better. You should use WordPress.

Me: What are you talking about? What's WordPress? All my blogging friends use Blogger.

Daughter 1: They're all old people who don't know any better.

Daughter 2: Don't listen to her, Dad -- Blogger is perfectly fine and totally cool.

Wife: What's a blog?

In my experience regarding e-matters, the youngest is generally right. So Daughter 2 (age 14) wins -- for now I'm staying with Blogger. I'm delighted to learn that Blogger is cool, and that by implication I'm cool.